Not a lot changed from last week’s COVID-19 update, so I’ve reduced the number of graphs to review to just the 5-day windowed moving averages.
COVID-19 cases in Colorado, by day of illness onset
For a larger image, click the figure. For a larger, interactive image, click hereThe most interesting, albeit unfortunate, feature of the new cases data is that the rate at which the number of new cases are occurring is slowing. Since about April 15, the rate of new cases has been dropping from a high of 440 (using the 5-day windowed average data at right) to 383 10 days later to 323 on May 5 to 303 on May 12 (the latest date that looks even remotely close to stable). It’s looking like the number of new cases per day is slowly stabilizing, and if the curve continues, it would likely stabilize somewhere between 200 and 250 new cases per day until the virus has either run its course through the entire population or an effective vaccine has been developed. And that’s probably low enough that the hospitals can handle it, or at least plan effectively for it.
The problem is that it’s unlikely to simply stabilize. People being people, once they hear that the number of new cases has stabilized, they’ll stop social distancing and wearing masks and all the other behavior modifications that brought the number of cases down to this point. Coloradoans already are doing that, in fact, and with the approval (or at least acquiescence) of Governor Polis. Which means that the number of cases will simply stabilize, they’ll climb.
And we’ll find ourselves right back where we were, or worse.
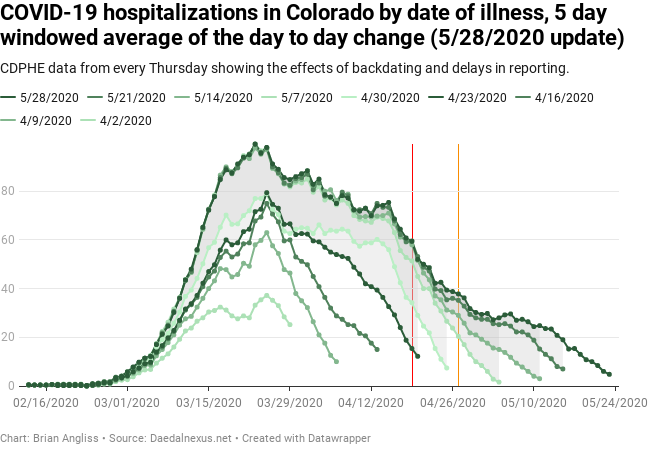
COVID-19 hospitalizations in Colorado, by day of illness onset
For a larger image, click the figure. For a larger, interactive image, click hereThere’s a problem with the new hospitalizations. Specifically, the drop in number of new hospitalizations is slowing. And it’s looking like it’ll probably stabilize between 20 and 30 new hospitalizations per day. That’s a lot better than nearly 100 new cases per day like we were seeing near the peak (per the 5-day windowed average at right), but it’s still a lot of new cases.
As with the new cases, 20-30 new hospitalizations a day is probably few enough that the hospitals can plan for it effectively. But it still adds up to a lot of people getting very sick. And as with the number of cases, hospitalizations are not likely to simply hover between 20 and 30. With the relaxation of restrictions in Colorado, hospitalizations are going to start going up again.
COVID-19 deaths in Colorado, by day of illness onset
For a larger image, click the figure. For a larger, interactive image, click hereThe data on deaths is what has me the most concerned. If you look at the number of deaths by date of illness (right), there’s a large number of new deaths for people who first got sick after Polis relaxed his statewide stay-at-home order to a “safer-at-home” order. We can’t currently say that the spike happened because of Polis’ changes in policy, or from anything in particular. In fact, the spike could be related to one or two bad outbreaks in nursing homes. We’ll have to wait on epidemiological reports to know that for sure. But the number of new deaths per day by date of illness onset has definitely stopped falling.
COVID-19 deaths in Colorado, by day of death
For a larger image, click the figure. For a larger, interactive image, click hereFrom the number of deaths by date of death (right), we can see that last week’s small lump around May 1 has turned into a much larger lump. This is at about the earliest we could expect to see impacts from the April 19 anti-lockdown protests, but it could be due to something else entirely. The larger concern is that we’re seeing signs of a slowdown in deaths by date of death just as we are deaths by date of illness onset. From about May 12 onward we see that the sharp decline in deaths has started to flatten out. I would expect it to flatten to roughly match, on average, the deaths by illness onset.
—
I don’t know yet what this all means, but I have a hard time imagining that it’s good.
Tune in next week when I look at the next week’s worth of data and try to divine what it means.