New cases, new hospitalizations, and new deaths are all growing exponentially and out of control. The only thing that will save lives now is another lockdown.
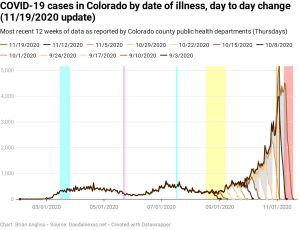
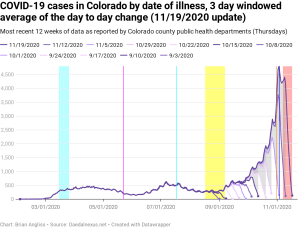
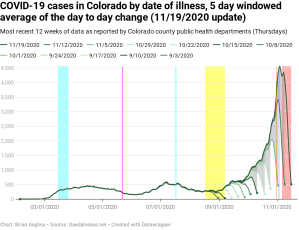
Cases are setting new records nearly every day, both for individual days and for the 5-day moving average I use to track cases. This is bad, and with Thanksgiving coming up (and far too many people refusing to hold the holiday virtually) it’s going to get worse soon.
I’ve been saying that we’re clearly in exponential growth, and if you’re familiar with what that looks like, a single look at the shape of the curve of recent cases and it’s obvious. But as looks can be deceiving, I looked at the data as well and, as expected, it’s exponential. More than that, the exponential growth started back in mid-September. I count three separate doublings that have happened since then, with the first taking 19 days, the second taking 20 days, and the third taking 16 days.
Anyone who says that this is a new phenomenon is wrong – we’ve been dealing with exponential growth in cases since just after schools went back in session. The problem is that, in the early phase of exponential growth, the increase is deceptively small. And Colorado got fooled by it again, just like we did back in March.
And as in March, the only way we’re going to stop it this time is by throwing everything we can at it – masks, distancing, school closures, locking down everything to essential needs only, and to hell with the economic consequences. Anything less won’t work at this point.
There are people who will claim that this is all because we’re testing more, but that’s wrong. You can’t get exponential growth from a linear increase in testing – literally, it’s mathematically impossible.
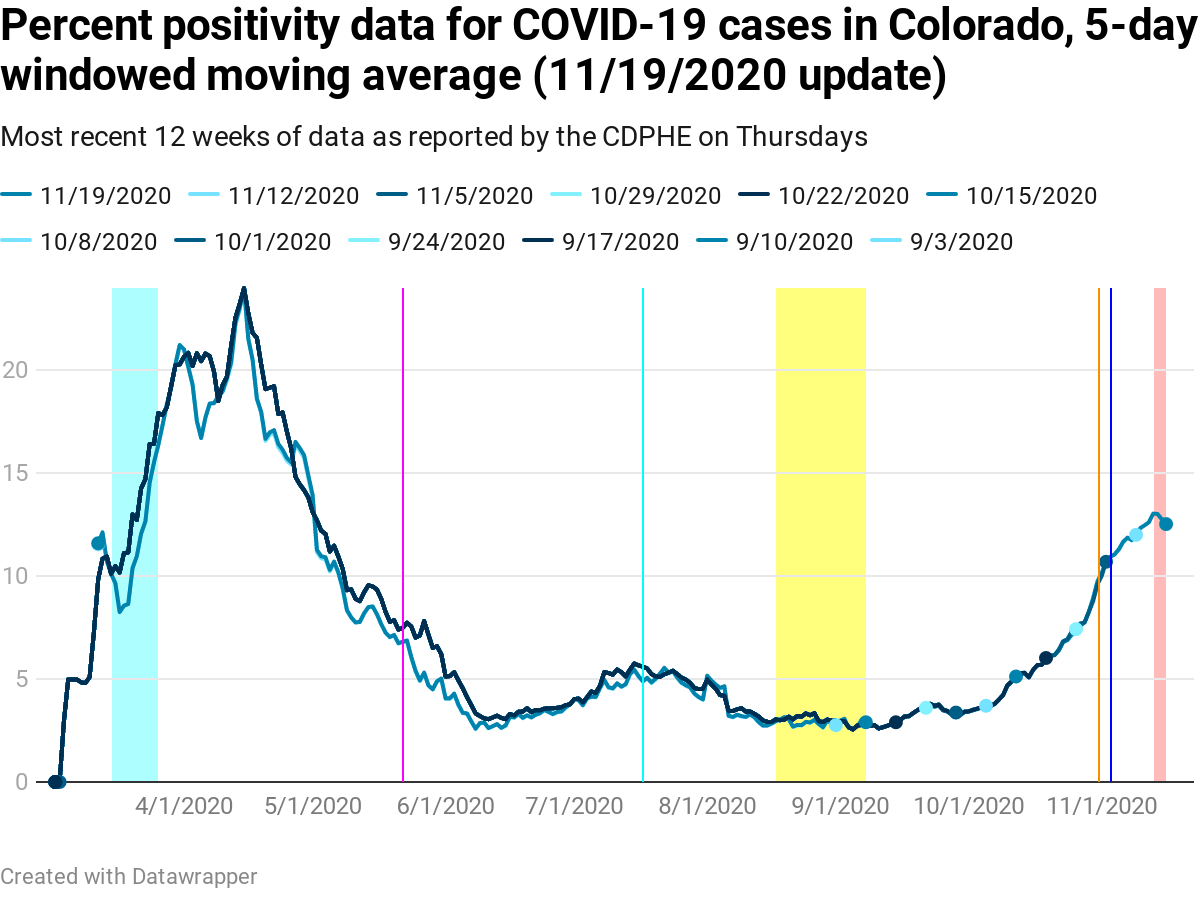
In the two weeks, the 5-day windowed moving average of test positivity percentage has risen from 10.69% to just over 13%. That’s the highest positivity percentage recorded since May 1. There may be a little sign of it slowing, but my guess is we’re seeing the post-Halloween increase slow. It’ll jump up again after Thanksgiving.
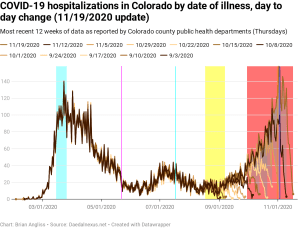
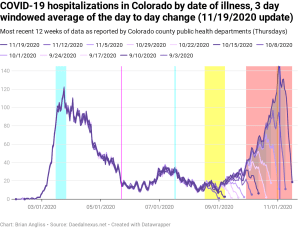
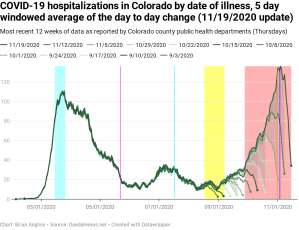
New hospitalizations by date of illness onset are now the highest they’ve ever been.
In my last update, I said that hospitalizations were rising more slowly than cases, and that was mostly true. Unfortunately, it was true because of the 11 day delay from developing symptoms. When I looked at the rate of exponential growth, new hospitalizations are growing exponentially and at a very similar rate to cases (18 days for the first doubling, 25 days for the second doubling). The second doubling seems slower, but given reporting lag in new hospitalizations affects the second doubling period but not the first, I’m going to hypothesize that it’ll be nearly exactly the same once the data settles down. Of course, by then it’ll be too late for anything but “I told you so.”
The only thing that is going to prevent hospitals from being forced to triage COVID patients (and any other patients who need critical care) into those worth treating and those left to die is a lockdown. Nothing else will be enough.
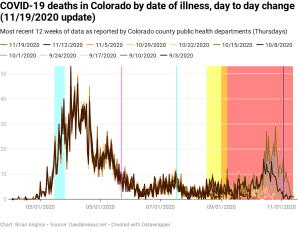
In the two weeks since my last update new deaths by date of illness onset have risen dramatically. This was entirely expected, and if you read my previous posts on this subject you’ll see I’ve been saying that this was going to happen for months now. I take no joy in being proven right, however, as being right this time means people are dying.
There’s too much short-term noise in the data to get a good feel for the doubling rate, but it looks to be in the 13-16 day range. We’ll want to look at the new deaths by date of death to get a better feel for the doubling rate as that dataset tracks hospitalizations pretty closely, albeit on a delay of about three weeks.


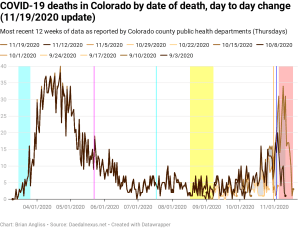
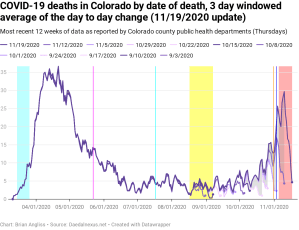
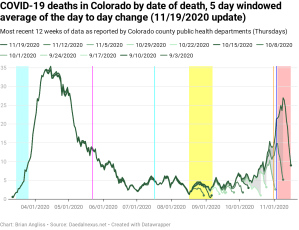
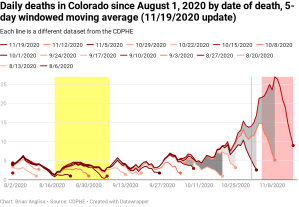
New deaths by date of death are continuing to increase and, if the rate of growth continues, will exceed the peak back in April within the next week or two. That’s until Thanksgiving infections drive another new spike in deaths.
The exponential growth rate of new deaths by date of death is the fastest of all the datasets I analyze, with two doublings at about 14 days each. That’s faster than hospitalizations or cases, and it suggests that pressures within the healthcare system impact deaths, not just the number of serious cases. Given there are a finite number of ICU beds, a finite number of ICU-trained nurses, a finite number of critical care doctors, a finite number of ventilators, and so on, this should not be a surprise. And the faster COVID spreads in the community, the faster doctors and nurses themselves get sick and have to isolate, further stressing the healthcare system and pushing it toward having to triage COVID cases.
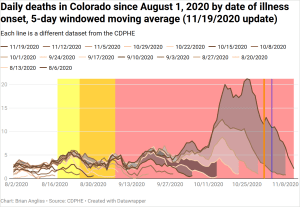
Finally, let’s compare the data for deaths by date of illness and the deaths by date of death since August 1, 2020, starting with the new deaths by date of illness onset, using the 5-day windowed moving average for both.
We still see that there are massive updates to the new deaths by date of illness onset data, but it appears from the gray areas (differences between one week’s dataset and the adjacent week) that the 79 days of instability I’ve calculated is probably too long. It looks like the data is unstable for more like 6 weeks, which is in line with what the CDC itself claims (1-8 weeks delay).
But both curves are rising rapidly as they’re driven by the exponential growth of cases and hospitalizations. And there is nothing to slow this down at this point.
In addition to the statewide totals, I’ve been following the COVID-19 dashboard for Jefferson County School District, the district where my kids attend high school and where my wife is a teacher. In the last couple of weeks I’ve watched the curve go exponential, but I would expect it to slow soon now that the district has gone to all-remote learning through the rest of the year. Regardless of what happens, though, we’ll learn a lot about how COVID spreads via schools and/or community.
At the moment the doubling rate appears that it might be in a narrower range than it was two weeks ago. Instead of 16-20 days, the three ways I’m estimating doubling rate now show between 17 and 19 days. We’ll see if that continues.
I’m glad that the district finally did the right thing. Given the exponential growth trend estimator I’m using uses the entire dataset back to August 31 to derive the growth rate, there’s a good chance that we’ve been dealing with exponential growth in the schools since they reopened, or at least since new cases went exponential in mid-September. The problem is that the trend wasn’t clearly exponential until early November. But if schools had gone all remote then, a lot of students, students’ families, and teachers, (including my wife) wouldn’t have been exposed to and contracted COVID.
—
We are in an exponential growth phase of the COVID-19 pandemic. It will not stop being exponential until either the state locks down completely to slow the growth or until it infects the entire state. The lockdown will save lives, and every life saved is one more life that can help rebuild the state once the pandemic is over.
The state needs political courage from its leaders. The time for being timid in the face of economic disruption and angry Coloradans is long since past.
—
- The first cyan highlighted region: between March 15 and March 26, Governor Jared Polis institutes controls statewide to reduce COVID-19 transmission.
- Magenta line: May 22, the date that most schools have ended for the spring semester and summer break starts.
- Cyan line: July 17, the day that Gov. Polis re-institutes a statewide mandatory mask order in response to rising cases of COVID-19 and the test positivity percentage exceeding 5%.
- Yellow highlighted region: August 17 to September 7, the period over which schools start the new school year with in-person, remote, or hybrid. Most schools are back in-person starting September 8.
- Orange line: October 31, Halloween. There are ways to trick or treat safely during a pandemic, but that doesn’t mean everyone was as careful as they should have been.
- Blue line: November 3, Election Day. With tens of millions of Americans standing in long lines and using equipment that may not have been properly sanitized between each use, I expect we’ll see an increase in COVID cases.
- Red highlighted region: This is the period of time that we can expect the data to change significantly (by more than 20%), nearly always increasing, due to updates from doctors, hospitals, labs, and morgues. I call it the “instability period” because the updates mean that we can’t trust the data to be accurate until this period of time has passed. It’s about 11 days for new cases, 4 days for test positivity percentage, 49 days for new hospitalizations, 74 days for new deaths by date of illness onset, and 13 days for new deaths by date of death.

Leave a comment