I don’t know what justification Governor Polis is using to keep the state open at this point, but we’re about to exceed the height of the first wave on nearly every metric.
What to say about new cases this week?
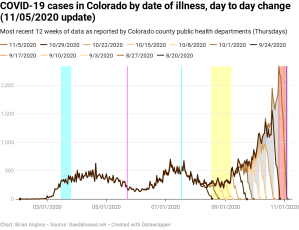
Well, as is obvious to anyone looking at the data, new COVID-19 cases are setting records. But as I’ve mentioned before, the total number isn’t the right thing to look at, as terribly impressive as the counts are. More testing does mean more new cases being discovered. So instead of looking at the raw number of new cases every day, let’s look instead at how fast the rate of new cases is growing – the acceleration of COVID-19 spreading through Colorado.
[Note: for the mathematically inclined, this is the derivative of the number of new cases every day, or the second derivative of the cumulative number of new cases.]
The highest acceleration of COVID-19 cases back in March was 30 additional cases being added to the new cases every day – 30 new cases one day, 60 new cases the next day, 90 new cases the next day, and so on. But that acceleration was the peak and only persisted for a short period. In July, we briefly exceeded that with an acceleration of 31 cases per day, but then Governor Polis imposed the statewide mask mandate and the acceleration faded almost immediately.
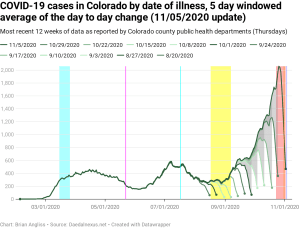
We’ve been largely above that level since the middle of September, with accelerations in the 60-75 cases per day. And what’s even worse, is the rate of acceleration is increasing, which means we’re dealing with exponential growth of COVID-19 in Colorado right now.
This very strongly suggests that the state will be going into lockdown again soon, or should be already.
As a reminder, the highlighted regions are described at the bottom of this analysis.

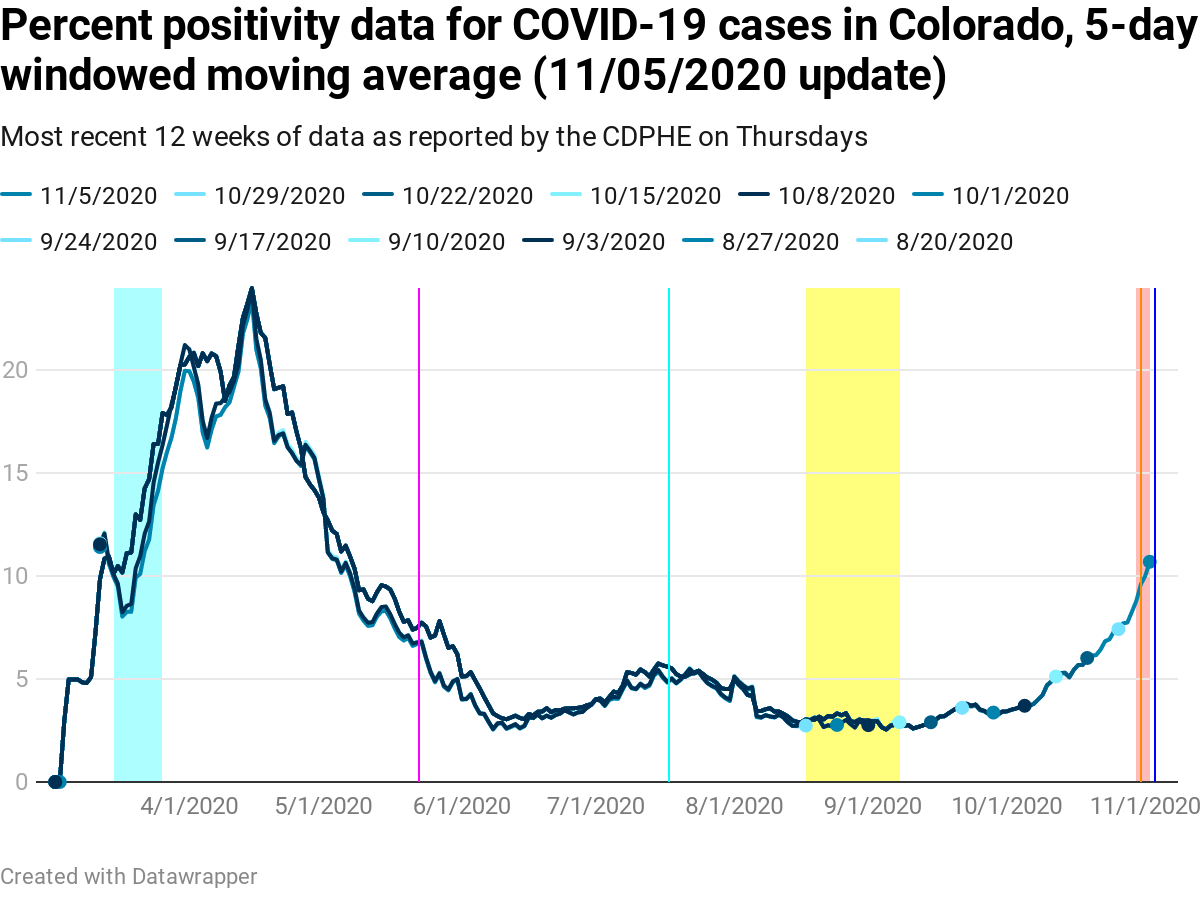
In the last week, the 5-day windowed moving average of test positivity percentage has risen from 7.42% to 10.69%. That’s the highest positivity percentage recorded since May 7, and it shows no signs of slowing down.
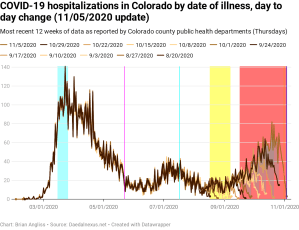
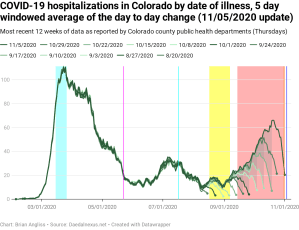
New hospitalizations by date of illness onset are now the highest they’ve been since mid-April. The 5-day windowed moving average has it at April 22, the raw data at April 20. As I wrote last week, we have shifted firmly into second (or third) wave territory.
If you look at the hospitalization data on the CDPHE’s dashboard (click on the Hospital Data, then Currently Hospitalized), you can see that the number of COVID patients currently hospitalized is approaching the heights of the first wave of COVID-19. That’s not a good thing.
My calculations show the instability period (red region) is 64-74 days at the moment, which is a large increase. It appears to be related to the rate of change in new hospitalizations – the faster the changes are, the longer it takes the data to finally stabilize.
The only good news I see here is that the acceleration in new hospitalizations by date of illness onset is lower than the acceleration in new cases. It’s not zero, however, which means we are seeing new hospitalizations increase as well. There’s probably some way to use the hospitalization data to correct the case data for increased testing, but I haven’t had the time to figure it out.

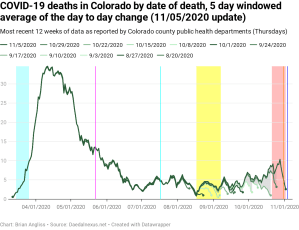
As expected, new deaths by date of illness onset are lagging the other data, but they’re also starting to rise significantly. We’re finally starting to see deaths rise as the people who were hospitalized early in this COVID wave start to die in larger numbers. On the scale of deaths from the first wave back in April, the current wave is still low. But even with improved treatments the number of deaths is going to go up, and if we exceed the capacity of our hospitals, it will go up a lot.
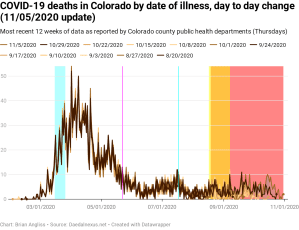


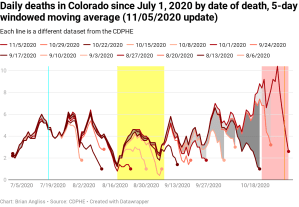
New deaths by date of death are continuing to increase. Unlike new cases and new hospitalizations, new deaths don’t look like they’re accelerating – yet. But they almost certainly will, and probably soon, if for no other reason than deaths follow hospitalizations.


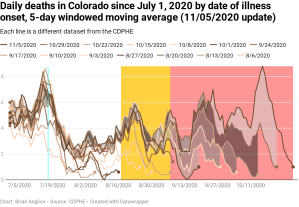
Finally, let’s compare the data for deaths by date of illness and the deaths by date of death since July 1, 2020, starting with the new deaths by date of illness onset, using the 5-day windowed moving average for both.
The most recent dataset shows an increase from last week’s data from 4.4 new deaths peak to 8.8 new deaths peak. For a 5-day average, that’s an increase in total deaths in the five day period measured of 22 deaths. That’s awful. And if you look at the grey area, it’s clear that it wasn’t just one day that went up.
COVID-19 is killing a lot more people now than it was over the summer.
Looking at the gray areas in the new deaths by date of death graph, we can see that there are massive updates from one week to the next and smaller updates even further back in time. But the more important thing to notice is that there is a clear trend in new deaths going back to mid-August. And zoomed way in like this, the trend looks like there might be a small amount of acceleration.
In addition to the statewide totals, I’ve been following the COVID-19 dashboard for Jefferson County School District, the district where my kids attend high school and where my wife is a teacher. I’ve been tracking the data on a daily basis, and looking at the data it appears that the data is showing acceleration in the number of cases per day. For those of you who have some statistics, the r2 value (a measurement of how well a trend matches the data) for an exponential growth trend matches the data much more closely than for a linear trend. And the doubling rate of the exponential growth is between 16 and 20 days.
That means we’re seeing an average of 40 new cases in Jeffco Schools right now, but in about 18 days we should expect to see 80 new cases a day. That’s right after Thanksgiving. And we should expect to see 160 new cases a day the week before Christmas. And then 320 new cases a day right as school comes back into session after the holiday break.
Does anyone really, honestly think this many cases in the schools is a good idea? And if so, for gods’ sake why?
—
The pandemic is out of control in Colorado. New cases are way up and growing at a faster rate than in March, when Governor Polis shut the state down. The only reason I can think that Polis hasn’t instituted another statewide lockdown is because the test positivity percentage is lower. But even that’s growing fast. And new hospitalizations are up enough that we’re likely going to shoot past the peak from March and April in the next week or two. And that’s assuming there’s no further acceleration as a result of Halloween and Election day, which would be a terrible assumption to make.
New deaths by date of illness onset are starting to match the rise of the hospitalization curve, and new deaths by date of death are rising noticeably.
It may already be too late to stop this wave of COVID-19 from being worse in Colorado than the first wave was. The only way we’re going to get through this is if we all start taking this pandemic WAY more seriously than we are. That means masks, distancing, avoiding large groups, personal hygiene. But it’s looking increasingly likely that we’re going to need to aggressively reimpose restrictions on restaurants, bars, and everywhere that people gather. Institute high fines for not wearing masks. And this means that Polis is probably going to have to become even less popular than he is now and institute a statewide lockdown again.
This is bad, getting worse, and at the rate things are going, it’s going to get much worse before it gets better again.
—
- The first cyan highlighted region: between March 15 and March 26, Governor Jared Polis institutes controls statewide to reduce COVID-19 transmission.
- Magenta line: May 22, the date that most schools have ended for the spring semester and summer break starts.
- Cyan line: July 17, the day that Gov. Polis re-institutes a statewide mandatory mask order in response to rising cases of COVID-19 and the test positivity percentage exceeding 5%.
- Yellow highlighted region: August 17 to September 7, the period over which schools start the new school year with in-person, remote, or hybrid. Most schools are back in-person starting September 8.
- Orange line: October 31, Halloween. There are ways to trick or treat safely during a pandemic, but that doesn’t mean everyone was as careful as they should have been.
- Blue line: November 3, Election Day. With tens of millions of Americans standing in long lines and using equipment that may not have been properly sanitized between each use, I expect we’ll see an increase in COVID cases.
- Red highlighted region: This is the period of time that we can expect the data to change significantly (by more than 20%), nearly always increasing, due to updates from doctors, hospitals, labs, and morgues. I call it the “instability period” because the updates mean that we can’t trust the data to be accurate until this period of time has passed. It’s about 11 days for new cases, 6 days for test positivity percentage, 39 days for new hospitalizations, 43 days for new deaths by date of illness onset, and 14 days for new deaths by date of death.

Leave a comment