This meme is a lie, and has been since March 26, just weeks after it would have been created. Please call out anyone who shares it.
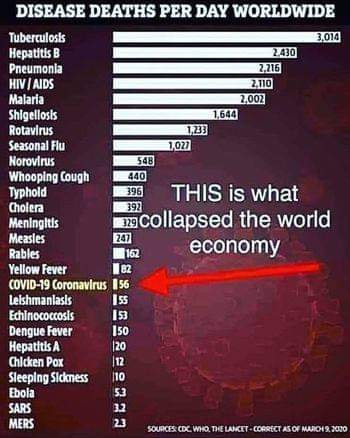
If you’ve been following COVID-19 news on social media, there’s a chance you’ve come across the meme at right. As with most memes, this one oversimplies reality so much that it’s essentially disinformation. Or put more explicitly, this meme is a lie.
Let’s look at why.
First, according to the sources and date listed on the bottom of the image, the data presented was correct as of March 9, 2020 and was pulled from the CDC, WHO, and the Lancet. Maybe that’s true, maybe it’s not, but people are still sharing this meme in early September, 2020, well after the data has stopped being accurate.
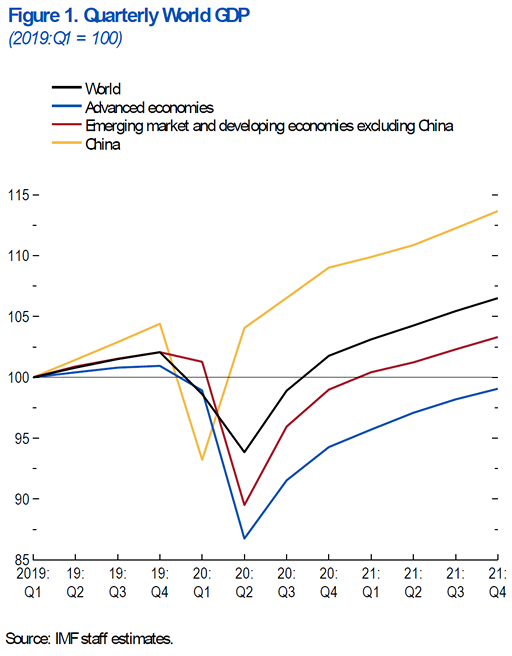
Second, the claim that 56 deaths per day crashed the global economy is incorrect. March is the start of the second fiscal quarter (March 1 through May 30), and according to the IMF (see image at the bottom of the article), there was only a modest impact to the global economy from COVID-19 in the first quarter of 2020 outside of China. And given there are 91 days in the second quarter, literally 90% of the global economic impact from COVID-19in Q2 would have been after March 9.
So the claim that the global economy had “collapsed” by March 9 or shortly thereafter is also false. And it’s not that the global economy collapsed, either. It’s an exaggeration at best.
Furthermore, as we can see from the John’s Hopkins figure below, it’s not so much the small impacts up to March 9 that resulted in a major hit to the global economy, but rather everything else that has happened since March 9. For reference,the cyan line is set at about the level on March 9 (which currently sits at about 180 deaths, not 56, but the difference could be updates that happen as the causes of death are better understood and testing improves), while the red line sits at about 3,000 deaths per day.

If you look at the meme again, you’ll notice that the top line item is tuberculosis, and it’s supposedly about 3,000 deaths per day. Which means that, even if the meme was accurate as of March 9, COVID-19 became the top infectious disease killer in the world on about March 26 and has stayed there every day but two since. The only two days COVID-19 wasn’t the top was March 31 and June 7, and given you can see a strong weekly structure to the data, those two days are an artifact of how the data is gathered.
And what really caused the economic decline? Not the approximately 4,000 deaths that happened worldwide by March 9, but rather the 870,000 additional deaths that have happened since. And nearly 26 million cases that caused people to miss work because they were sick or they had to tend to someone else who was sick.
The United States government has calculated that the statistical value of a life is about $10 million. Now, that’s just the US, but let’s apply it to the 874,000 dead so far. 874,000 multiplied by $10 million is $8.74 trillion dollars of direct economic losses from deaths alone. The global GDP in 2019 was 142 trillion, so the direct losses from deaths alone is 6% of the global GDP.
So far. And the number is going to continue to rise.
So what’s the verdict on this meme? It’s propaganda. It’s disinformation. It’s dishonest. And the version that’s circulating that has the source and date cut off is even worse.
And in my opinion, anyone who has shared it is either grossly misinformed, naive, or a liar.

Leave a comment