On March 14, Governor Polis of Colorado ordered all Colorado ski areas closed until mid-April, effective March 15.
On March 16, Polis closed all dine-in restaurants, gyms, casinos, and movie theaters, effective the following day.
On March 18, Polis closed all primary and secondary schools in the state of Colorado to in-person instruction, effective the following Monday (March 23rd). He also ordered that there be no gatherings larger than 10 people anywhere in the state.
On March 19, Polis ordered all “elective” surgeries and medical procedures to stop, effective March 23rd.
On March 22, Polis ordered all businesses to reduce their in-person employees by at least 50%, effective March 24.
On March 25, Polis instituted the statewide stay-at-home order, effective March 26.
There are people who will claim that none of these by the Governor were necessary.
Those people are wrong.
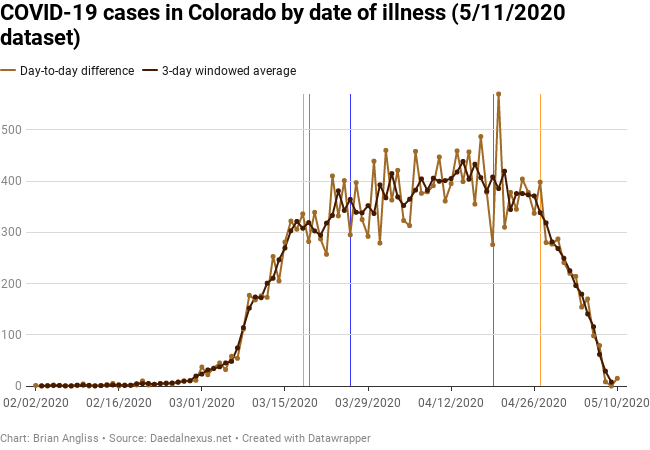
In the following figure, generated using COVID-19 data downloaded on 5/11/2020 from the Colorado Department of Public Health and Environment, I’ve graphed the daily increase in number of cases. The green line is when Polis ordered schools closed, the magenta line when he ordered an end to elective surgeries and extended/expanded the closure of dining in, and the blue line when Polis issued his state-wide order stay-at-home order.
It’s obvious that the number of COVID-19 cases by date of illness onset (ie the day that people started feeling ill) in Colorado went from growing exponentially to growing much slower immediately following the closure of public facilities like restaurants, schools, and theaters. It’s less clear whether the stay-at home order did much, but with the closure of all those other public areas to large groups of people, I would argue that huge numbers of people were essentially staying at home already, especially once schools were closed.
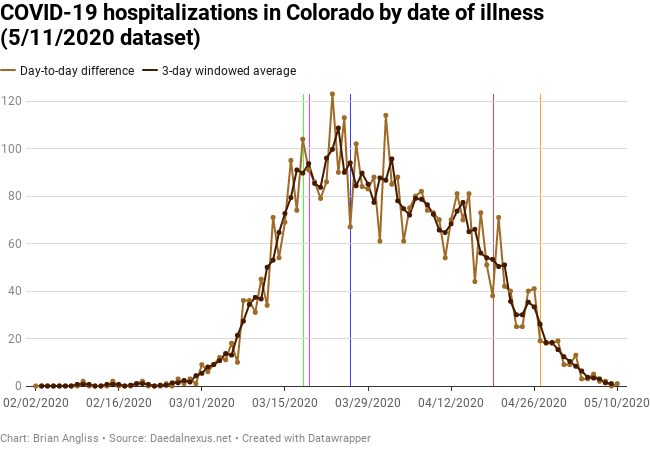
We can also see a similar transition in the number of COVID-19 hospitalizations by day of illness onset. In this case it looks like there might be an early transition and at around March 19 and another around March 25, but that could just be noise. What is obvious is that the decline in the rate of new hospitalizations for COVID-19 starts in the period that all of Polis’ mitigations are being put into place. Again, this shows that the mitigations worked.
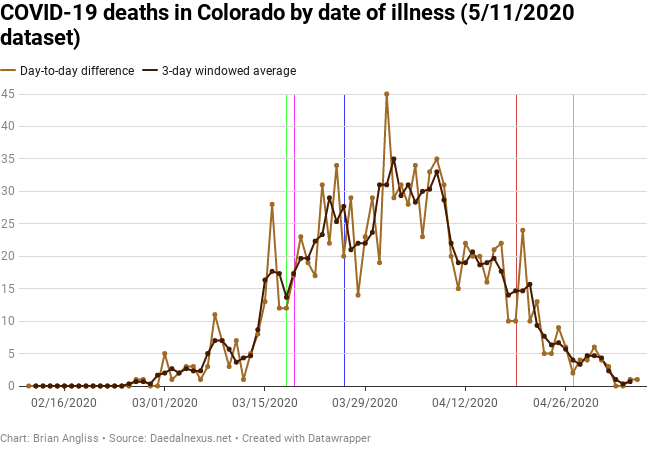
The data on new deaths per day of illness onset is admittedly less clear. The lower overall number means that noise more easily hides any signal. It looks to me like there is a difference between the growth rate before schools and businesses were closed and after, and another difference after the stay-at-home order was put in place, but it’s only the second one we can be certain of. There is no question looking at the graph that there is a significant reduction in the rate of new deaths after the stay-at-home order was put in place.
What does this tell us?
It tells us that, contrary to what the anti-stay-at-home activists claim, Governor Polis’ mitigations were effective. They worked. And by arresting the exponential growth curve that Colorado’s cases were on, the mitigations saved lives.
[Ed. Note: data after about 4/19 is unstable and shouldn’t necessarily be trusted. It’s left here for the sake of completeness of the datasets, but just because it shows the number of new cases, hospitalizations, and deaths dropping rapidly doesn’t mean that they actually are. For more on this, read this post]

Leave a comment