
The number of new cases is down. New hospitalizations are down. Deaths are also down, but they show worrying signs of stabilizing at levels higher than I would want to see.
It’s been two weeks since my last COVID-19 update, so we should know twice as much, right? Not necessarily. But there is some cause for cautious optimism in the cases and hospitalization data, just as there some cause for concern in the death data.
COVID-19 cases in Colorado, by day of illness onset
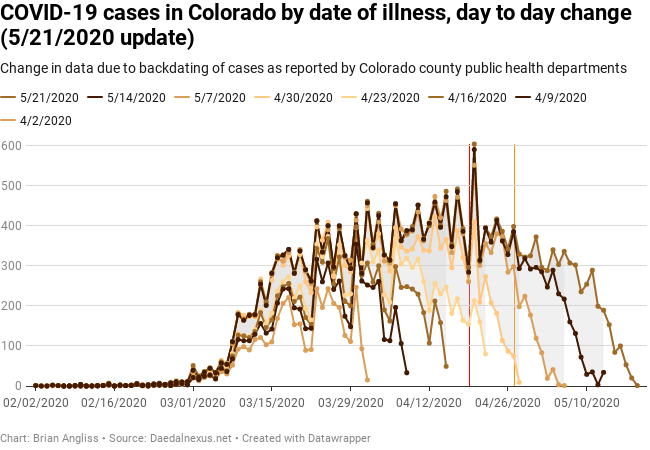
As usual, let’s start our review of COVID-19 cases with the raw data (top right). We can see that the spike on April 20 is now the largest single day increase in cases, at 604 cases. But we shouldn’t necessarily ascribe this to the anti-lockdown protests that happened on April 19 because the usual incubation period for COVID-19 is 5-6 days. So it’s more likely that this spike is an artifact of weekly sampling effects or due to an outbreak or two that happened to hit then, or even to a change in how cases were counted. I believe that I said it might be related to the protests in a previous update, so I was wrong when I said so.
As usual, the raw data is very noisy and bouncing all over the place. And we can see that backdating of cases is causing significant variation from one week’s dataset to the next. It looks like the recent weeks have seen the backdating effect result in more like three weeks of instability instead of four, but it’s difficult to say for sure. Given the week delay from infection to the onset of symptoms, and then another week or two until someone is feeling sick enough to get a test, we’re not likely to see the cases be stable any quicker than about three weeks after any given date.
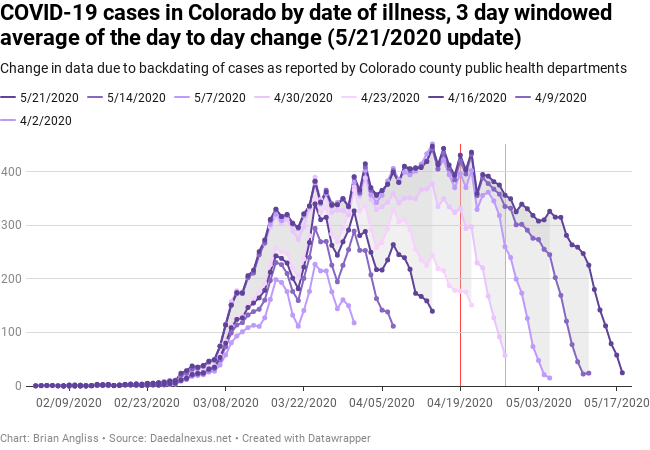
Looking at the 3-day windowed data (middle right), it does still look like the number of cases is becoming stable about a week sooner in the last few weeks’ datasets. But looking back to mid march, we can see that there was a period when the data was relatively stable and then took a large jump in the week between the 4/23 and 4/30 datasets. As a result, we should be cautious about making too many predictions.
The 3-day windowed data largely erases the big single-day spike on April 20, but we’re seeing a secondary spike around April 23 and 24 continue to slowly rise up. This spike could be an artifact, but it’s also potentially related to the anti-lockdown protests. And there’s a spike starting to form around May 5, which would be about a week after Governor Polis relaxed statewide restrictions from “stay-at-home” to “safer-at-home.” We should keep an eye on both of those over the next week or two and also look to see if there’s any corresponding increases in hospitalizations and/or deaths.
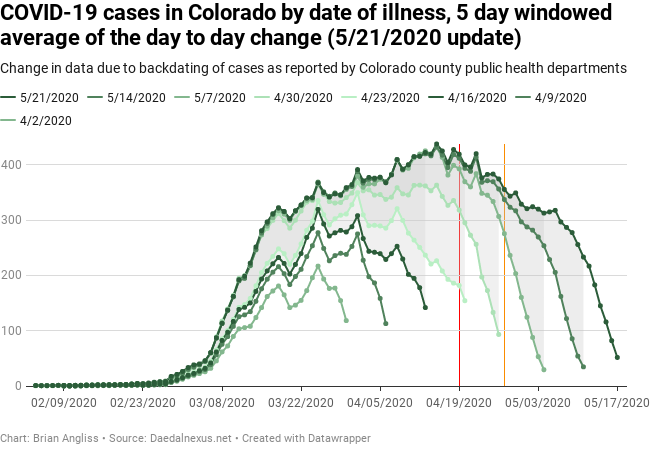
The same two bumps in cases exist in the 5-day windowed data (bottom right) as well, and there’s a spike April 22 that wouldn’t need too many more adjustments to become the new maximum number of cases. But the trend is starting to look better, with an apparent reduction in the number of cases. Next week will tell us a lot more about whether or not we saw a reduction in cases up to Polis’ end of the lockdown or whether the number of cases continues to trend downward.
COVID-19 hospitalizations in Colorado, by day of illness onset

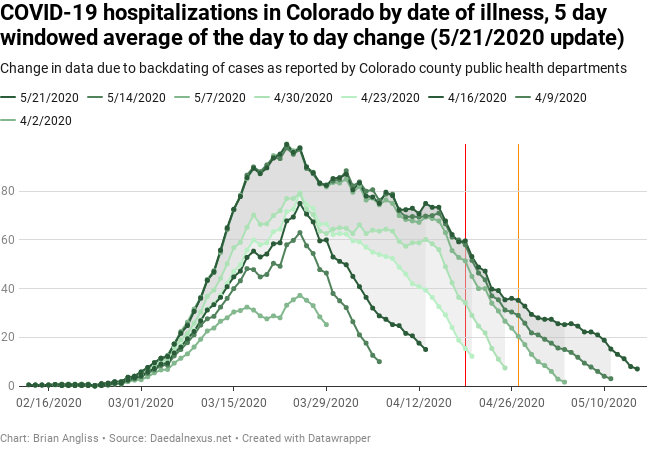
The raw data for hospitalizations from date of illness onset (top right) is so much harder to read than the cases data, but it’s a more useful metric. The number of cases is dependent on the number of tests and people seeking medical help, but the number of hospitalizations is independent of testing. But because there’s naturally a much lower number of people needing to be hospitalized for COVID-19, expected variation in when people seek and are admitted into the hospital just looks larger in the raw data.
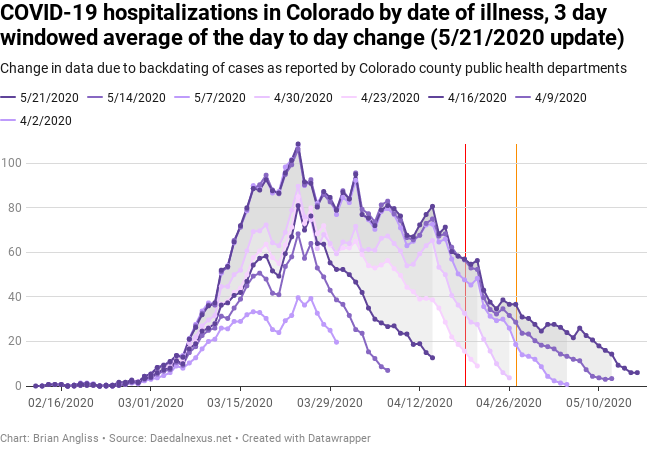
So it’s much more useful to look at the 3-day windowed data instead (middle right). And here we see some features. For example, there is a small hump in cases on April 26, six days after the anti-lockdown protests. And there’s another small hump about five days after Polis ended the statewide lockdown.
There’s another important observation here, and it’s one that might offer some cautious optimism. If you look at the difference between the first week’s data and the second week’s data back in April, you’ll see that the backdating adjustments were adding as much as 30 new hospitalizations in the first week, another 10-15 in the second week, and as much as 10 in the third week. Recent datasets are adding more like 15 cases in the first week, then 10 in the second, and then more like five in the third. And the starting level back in April was 10-20 hospitalizations, while the datasets in May have all started at less than ten. This is good, and hopefully it will continue.
My main concern with the hospitalizations shows up in the 5-day windowed data (bottom right). We still see the hump about six day after the protest, and it’s grown significantly in the last week. But the bigger concern is that the rate of new hospitalizations slowed starting about a week after “safer-at-home” was put in place statewide. With the relaxation of the statewide lockdown, it’s starting to look like the rate of new hospitalizations has hit a plateau.
The question is whether Polis’ and local county’s continued relaxation of restrictions (such as Douglas County’s reopening of restaurants and the Park Meadows Mall on May 23) is going to result in a completely flat or even slow increase in new hospitalizations. I’m going to go a little out on a limb and project that, based on what the data is showing, we’re going to see the number of new hospitalizations flatten and start to increase again over the few weeks.
I hope I’m wrong.
COVID-19 deaths in Colorado, by day of illness onset


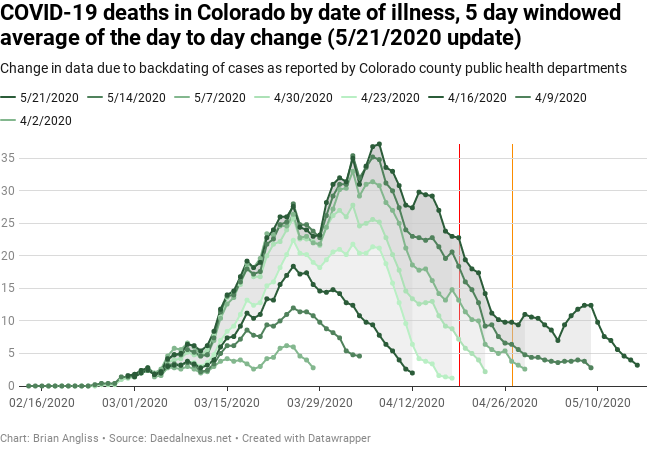
As with the hospitalizations, the raw data on COVID-19 deaths by date of illness onset (top right) is really noisy and difficult to draw any significant conclusions from. But there are a few observations. First, there’s a big spike in deaths on April 20, just like there was a spike in the number of cases on that same day. Given the timing, it’s more likely that the spike in cases is due to one or more outbreaks rather than the anti-lockdown protests. Second, there’s a small spike in new deaths forming on April 25 that might be associated with the same hump in number of new hospitalizations and, given it’s six days after the protests, could be correlated with the protests. We’ll have to see.
Third there are two large spikes in new deaths on May 1 and May 7. The one on May 1 could be related to people rushing out after Polis’ stay-at-home order was relaxed, but it doesn’t have to be. But there’s nothing specific that I could find that might be connected to the May 7 spike. My guess is that it’s due to an outbreak in a care facility or two, but it could also be tied to one or more counties reopening prematurely. I haven’t take the time to dig into the data deep enough to say one way or another.
Looking at the 3-day windowed data (middle right), we see that the data has changed a lot since the 5/7 dataset I reported on most recently. The peak is now on April 8, there’s a new hump around April 14 that popped up, and the two humps at around April 30 and May 7 are large and concerning. It looks like the number of new deaths by date of illness onset has stopped decreasing and hit a potential flat spot at around 10 deaths per day from COVID-19. That’s not a lot, but it’s summer, when diseases like this should be essentially nonexistent.
Also, while the data on cases and hospitalizations seems to be stabilizing after three to four weeks, the data on deaths from date of illness onset is taking more like five or even six weeks to stabilize. That’s not surprising given that some of the sickest people are taking 4-8 weeks to recover or die from COVID-19, but it’s still concerning. It means we’re even further behind understanding the data on deaths than we are the data on hospitalizations and cases.
The 5-day windowed data (bottom right) has me even more concerned, because it shows even more clearly that we’ve likely hit a plateau with respect to deaths at around 10 COVID-19 deaths per day. And it’s possible that we’re seeing the start of a slow increase in the number of deaths in May, likely as a result of relaxations in stay-at-home orders. If this is what’s happening, we’re likely to see the number start to climb even more now that schools are on summer break and people are starting to travel, socialize more, and let their kids play together.
COVID-19 deaths in Colorado, by date of death
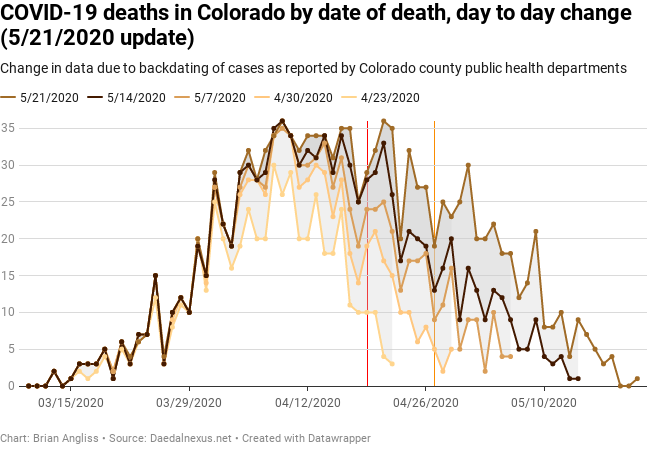
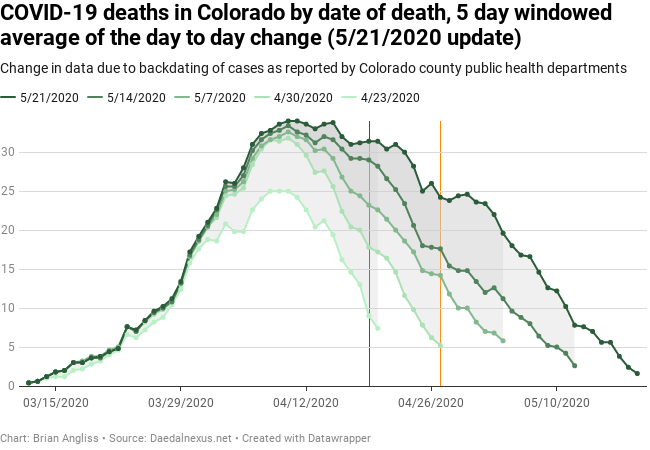
I keep coming across people who like to point out that the number of new deaths from one day to the next is down to one or two a day, and while they’re not wrong, they’re wrong. Looking at the raw data for the number of deaths by date of death (top right) shows the exact same backdating instability as the cases and hospitalization data does. For example, in the 4/23 dataset, there were only 3 deaths on April 22. But that was revised upward to 15 deaths a week later, 21 deaths the following week, 26 deaths last week, and 35 deaths as of this most recent dataset, the 5/21 dataset. Similarly, the 5 deaths on April 29 was revised upward to 23 deaths by the 5/21 dataset. Backdating continues to trip up well-meaning people and provide opportunities for disinformation to those with political axes to grind.
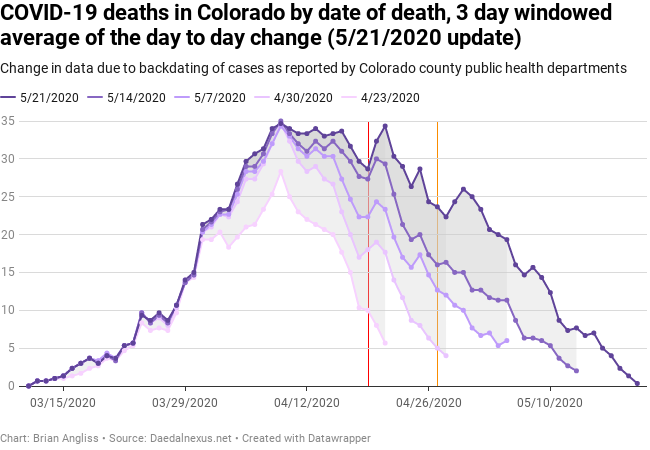
In the 3-day windowed data (middle right) we’re seeing that what looked like it might be a slowing of the number of deaths has instead turned into a wide plateau up in the mid-30s between April 8 and April 21, followed by a slow reduction in new deaths per day since. Unfortunately, every new week’s worth of data seems to be turning up enough new deaths attributable to COVID-19 that the number of new deaths is not slowing as quickly as we would hope. And the decline in new deaths around the anti-lockdown protests was an illusion.
Looking at the 5-day windowed data (bottom right), we see that there could very well be a hump forming around April 30, which is about the earliest we would expect to see COVID-19 deaths as a result of transmission from the April 19 anti-lockdown protests. That doesn’t mean that the hump will continue to show up in the data in the coming weeks, or that there is any correlation between the dates, but nothing precludes a connection between them either.
I’m going to make another projection, based on what we know about how the data works, and say that I’d expect the April 30 hump is likely to turn into a plateau that persists for at least another 3-4 days, and that we’ll see this happen in next week’s dataset. What we really don’t want it to do, however, is to turn around and start climbing again.
—
The number of new cases is down. New hospitalizations are down. Deaths are also down, but they show worrying signs of stabilizing at levels higher than I would want to see. Keep in mind that 10 deaths from COVID-19 per day over a year would make COVID-19 one of the top five killers in Colorado, and 20 deaths per day would have it at #2.
There are a couple of things I’m going to be looking for over the next few weeks. I’m expecting to see a small uptick in new cases, hospitalizations, and deaths after Mother’s Day, and I’m expecting a sustained, but slow increase in cases, hospitalizations, and deaths starting around June 1 as a result of the end of the school year around the state and the long Memorial Day weekend.
There is cause for cautious optimism in the data, as well as cause for reasonable concern and caution. As my advice has been since this started – stay at home when you can and always wear a mask if you’re out and about.

Leave a comment