
With another week of data behind us, we see that what appeared to be a decline in the number of cases, hospitalizations, and deaths wasn’t much of a decline at all. And we can expect that yet more data will raise each of the curves again in the next week.
In my last COVID-19 post, I dug deep into the data as presented by the Colorado Department of Public Health and Environment and showed that the data didn’t really show what it needed to in order to justify relaxing the statewide stay-at-home order like Governor Polis put into place starting on April 27 and fully into place on May 1. With another week of data to review, I can confidently say that my conclusions last week remain correct. Unfortunately.
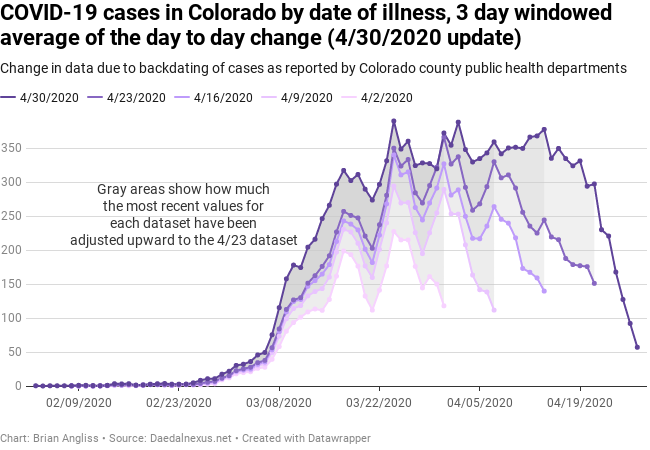
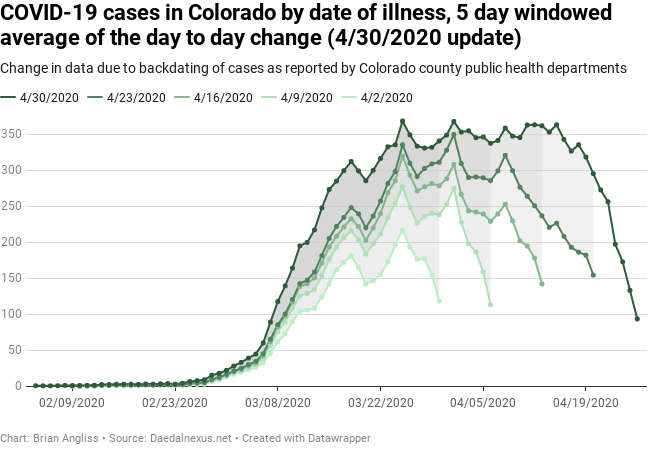
COVID-19 cases in Colorado, by day of illness onset
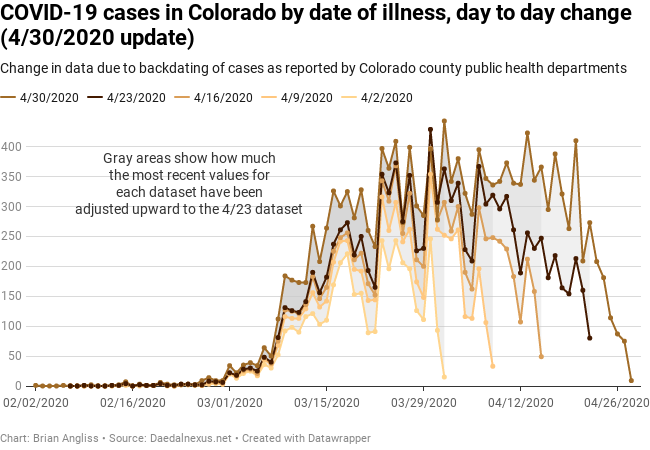
In the 4/23 dataset, it looked like there was a potential downward trend in the number of cases. This trend was visible in the raw data (albeit very noisy), the 3-day windowed average, and the 5-day windowed average. But I warned readers that every previous week had seen significant upward revisions in the number of Colorado COVID-19 cases, so it was probably not correct.
Unfortunately, as of the 4/30 dataset, we can see that my warning was well justified. The jump in the number of cases for the period of April 16 through April 22 between the 4/23 and 4/30 datasets was between 49 cases (minimum, on April 21) and 197 cases (maximum, on April 20). That’s a massive change. The prior week’s data (from April 9 to April 15) jumped between 47 and 167 counts. Even the data from early April showed upward revisions in the number of cases between 17 and 94 cases.
We can see more clearly from the 3-day and 5-day windowed averages that the number of COVID-19 cases in Colorado by illness onset has not fallen as expected and hoped. It has, in fact, plateaued. This is not what the number of cases needs to do in order to justify Governor Polis’ relaxation of the statewide stay-at-home order. It’s good news that the number of new cases is stable, but we shouldn’t have relaxed the stay-at-home order until the number of news cases had dropped significantly.
I’ll also be keeping track of what happens to the number of cases after April 19, when Operation Gridlock sent hundreds of anti-lockdown protesters to the Colorado Capital, the bulk of whom did not practice social distancing or wear masks as they should have. I expect to see a bounce in statewide cases start to show up in the data soon. And I expect a significant bump after April 27th as the stay-at-home order expired. Finally, I expect an even bigger bump starting after May 1, when barbers and salons were allowed to open under restrictions.
I truly hope I’m wrong, but I don’t think I am.
COVID-19 hospitalizations in Colorado, by day of illness onset
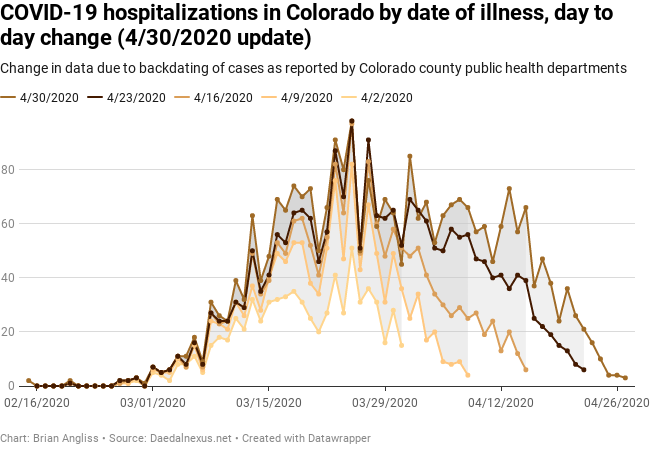
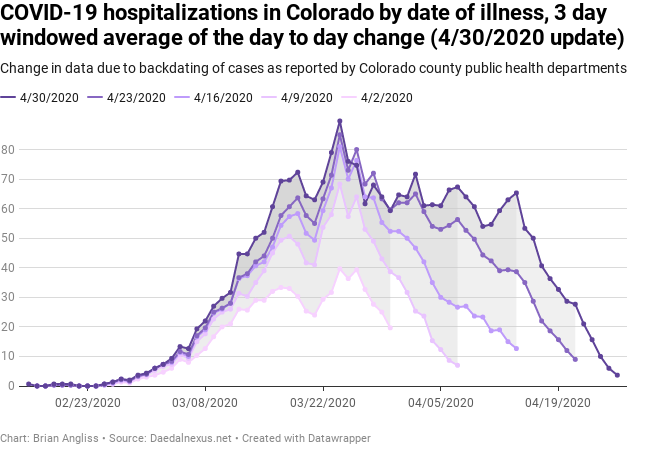
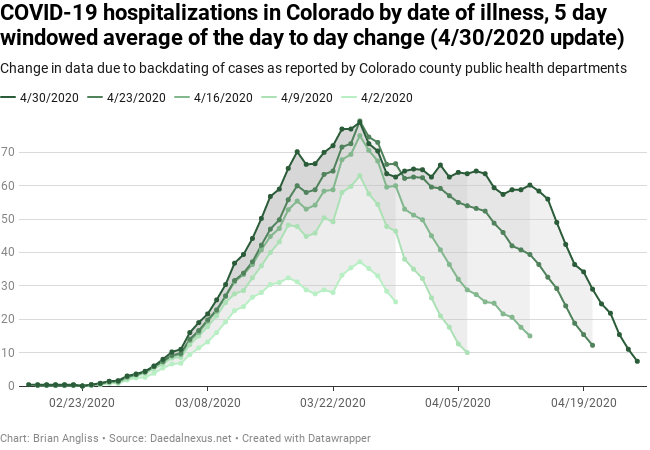
In the 4/23 dataset from last week, we saw indications in the raw data, the 3-day windowed average, and most clearly in the 5-day windowed average that the number of hospitalizations per day by date of illness onset was not dropping as fast as it had in previous weeks. As of the 4/30 dataset we can see that these early indications were, in fact, correct.
While the increases in total number of hospitalizations is not as dramatic as with the number of cases above, the increases are still significant, ranging from as low as 9 to as high as 27, which is a similar percentage change as with the number of cases. In fact, there were increases (and a few decreases too) as large as 16 as far back as April 1 and the largest chnage was 37 new hospitalizations on April 13.
Keep in mind the dataset was produced on April 30.
So what does it mean? While the peak in hospitalizations by date of illness onset occurred back on March 25, we’re seeing significant secondary peaks as late as April 13. And we can expect to see those secondary peaks continue to grow. At this point there’s no way to know if the secondary peaks will exceed the primary peak in late March, but we can’t discount the possibility. After all, the April 13 peak is only 24 hospitalizations below the March 25 peak, and the data shows jumps larger than that back 3-4 weeks. Put another way, we’ve got another 2 weeks before we’re sure that the true peak in hospitalizations by date of illness onset isn’t 4/13.
And if we see the bump up in cases and hospitalizations I expect due to the protests and Polis’ relaxed executive order, we’ll likely see it go up even more, and well into May, before it finally comes back down.
COVID-19 deaths in Colorado, by day of illness onset
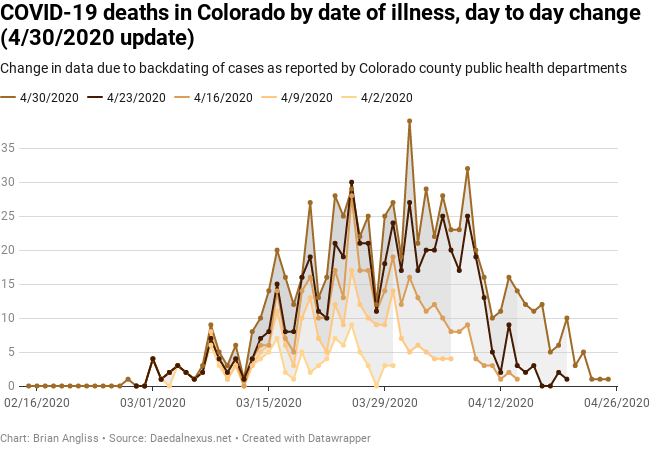
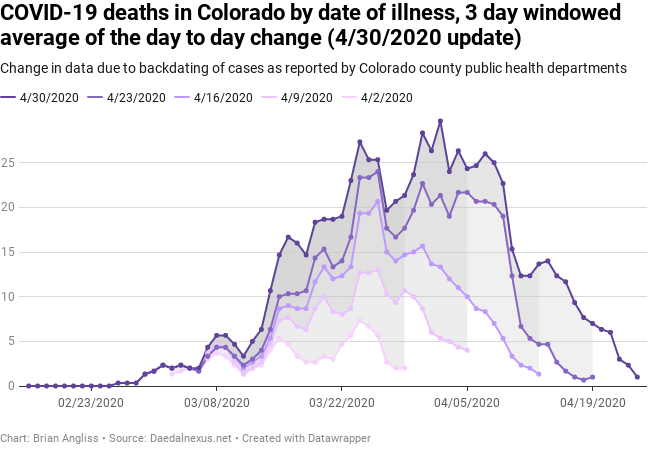
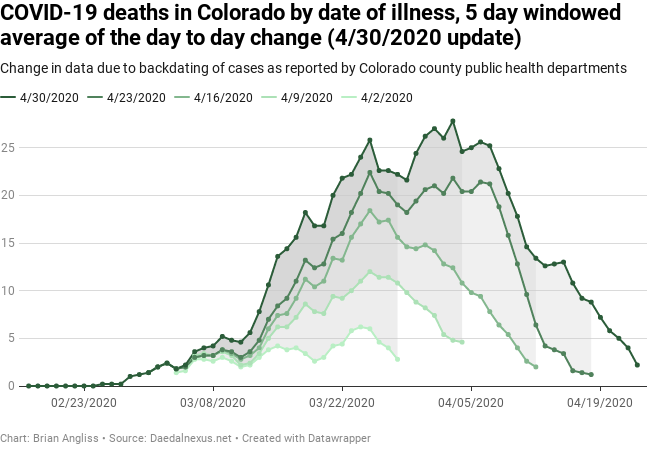
Now let’s look at COVID-19 deaths by date of illness onset. Remember last week, when I pointed out that it looked like there was a plateau in the number of deaths by illness onset? We can see this week that this plateau is real. It’s hard to see in the raw data because bounces around so much, but the 3-day windowed average and the 5-day windowed average show the plateau very clearly. In fact, between the 4/23 and 4/30 datasets, the overall peak in deaths shifted from 3/25 to 4/1, with a strong second peak on 4/8.
We see similar increases as far back as 2-3 weeks prior to the date of the dataset, but then the magnitude of updates falls off quickly. This means that the data is quite stable once we’re about three weeks past the date of interest, but up until that point we can’t really say anything about the data. And given the entirety of the number of deaths is within about 20 counts of the peak, we can’t assume that the number of deaths will actually fall off in any meaningful way for several more weeks.
One thing of minor note is that we may be seeing some early signs of spikes in the data. There were a couple of small bumps in the 4/23 data that grew to be significant by the the 4/30 dataset. No way to know until later, however.
Again, I’ll be watching the data to see if there’s any new surges in deaths that can be even partially attributed to the 4/19 protests or the relaxation of the stay-at-home order, but given deaths lag both hospitalizations and cases and there’s not yet enough since 4/19 to see anything, I don’t expect anything this soon.
COVID-19 deaths in Colorado, by date of death NEW

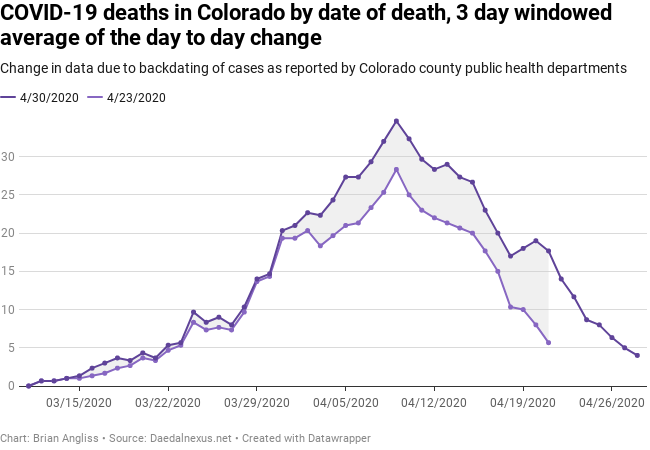
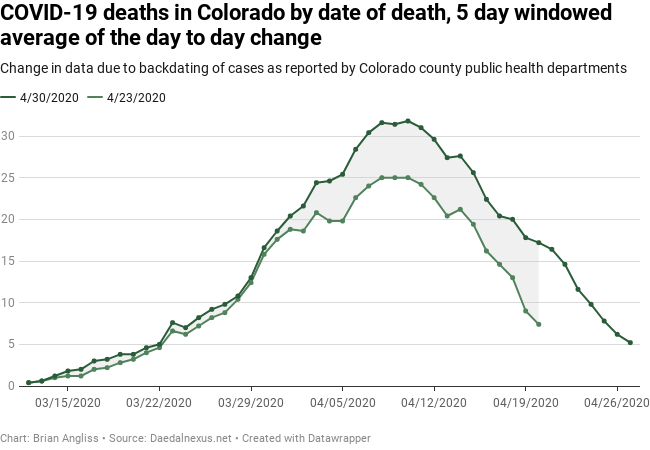
Colorado started recording deaths by the date of death in their .csv datafiles sometime between the 4/16 and the 4/23 datasets. As we now have two data points, I’ve added this to the information I’m tracking.
I don’t have a whole lot to say about the data yet. Two data points isn’t really enough to say much, unfortunately.
—
The more I look at the data and the longer I track it, the less sure I am that Governor Polis did the right thing with respect to relaxing the statewide stay-at-home order. I’ll be thrilled if I’m wrong about this, but at the moment I’m just not seeing the justification for the relaxation in the available data.
But what’s done is done. What I would recommend the Governor do now is start the process of pointing out that, if there is a bounce in COVID-19 cases, the state should expect him to reinstate the stay-at-home order indefinitely. The sooner he starts tilling this particular soil, the quicker he’ll be able to do so if the data does what I’m afraid it will and show a strong increase in the number of cases, hospitalizations, and deaths.
