
Imagine, if you will, that gun control advocates successfully amend the Second Amendment. What level of national support would it take to do that?
For other parts of this series, click here
With all the gun violence happening in the US these days, it’s not outside the realm of possibility that We the People might someday demand changes to the Second Amendment itself. For example, large majorities (between 84% and 96%, depending on how the question is asked) of the US population that support universal background checks for all firearm purchases, including private sales between individuals. Yet there are individuals who claim that requiring background checks for private sales is against the Constitution.
So let’s imagine for a moment that a supermajority of people of the United States have finally had enough of mass gun violence, of gun suicide, of gun homicide, of gun-aided domestic violence, and of all manner of gun violence. Let’s imagine that the majority of We the People have called for changes to the Second Amendment. Imagine that Congress and the states listened. And imagine that the Second Amendment was reworded to make some limits explicit and acceptable per the new, amended Second Amendment.
Article V of the Constitution of the United States of America
When the authors of the Constitution wrote it, they included in Article V a mechanism to change and update the Constitution. They knew they couldn’t predict everything, and they understood that even the Constitution would need to be updated from time to time. But they also wanted updating the Constitution to be difficult so that any updates would represent a large supermajority of We the People.
The Congress, whenever two thirds of both houses shall deem it necessary, shall propose amendments to this Constitution, or, on the application of the legislatures of two thirds of the several states, shall call a convention for proposing amendments, which, in either case, shall be valid to all intents and purposes, as part of this Constitution, when ratified by the legislatures of three fourths of the several states, or by conventions in three fourths thereof, as the one or the other mode of ratification may be proposed by the Congress; [emphasis added]
Passing an amendment to the Constitution requires that 2/3rds of both the House of Representatives and the Senate agree on the amendment, and then that ¾ of state legislatures (or state conventions) ratify the amendment. How much of the US would have to be represented by the House, the Senate, and the states themselves in order for something like this to happen? And how tectonic of a shift would be required in opinions about guns for an amendment to the Second Amendment to pass in the first place?
The House of Representatives
In order to answer that question for the current membership of the House of Representatives, I collected data from the Cook Political Report Partisan Voter Index (PVI), the CityLab assessment of Congressional districts for their urban/rural makeup, and the US Census Bureau population estimates for every Congressional district in 2018 with respect to ethnicity, age, sex, and housing units.
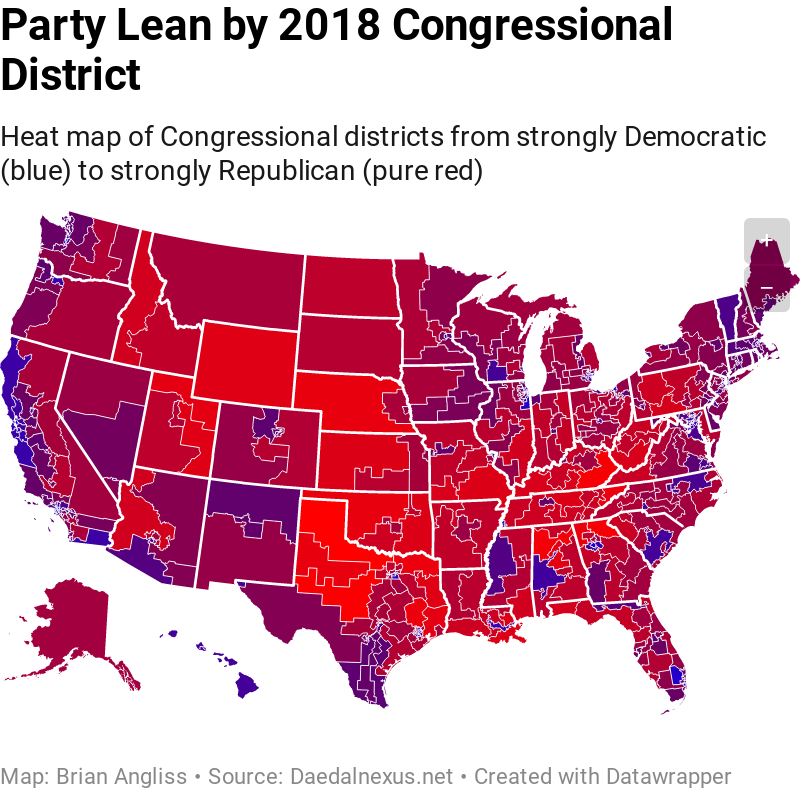
I used the Cook PVI data to sort each member of the House of Representatives into an order from the most Democratic to the most Republican Congressional districts, operating on the assumption that the most liberal districts would elect Representatives that would be the most likely to to vote for amending the 2nd Amendment. Given that issues of gun rights do not strictly follow Democratic vs. Republican lines, this isn’t an entirely valid assumption, but I was unable to locate the National Rifle Association’s (NRA) gun grades for the current Congress to use as a cross-check, so we’ll follow this assumption for now. [Note: the NRA has removed their publicly available grades for every Representative and Senator from their website since the Parkland shooting.]
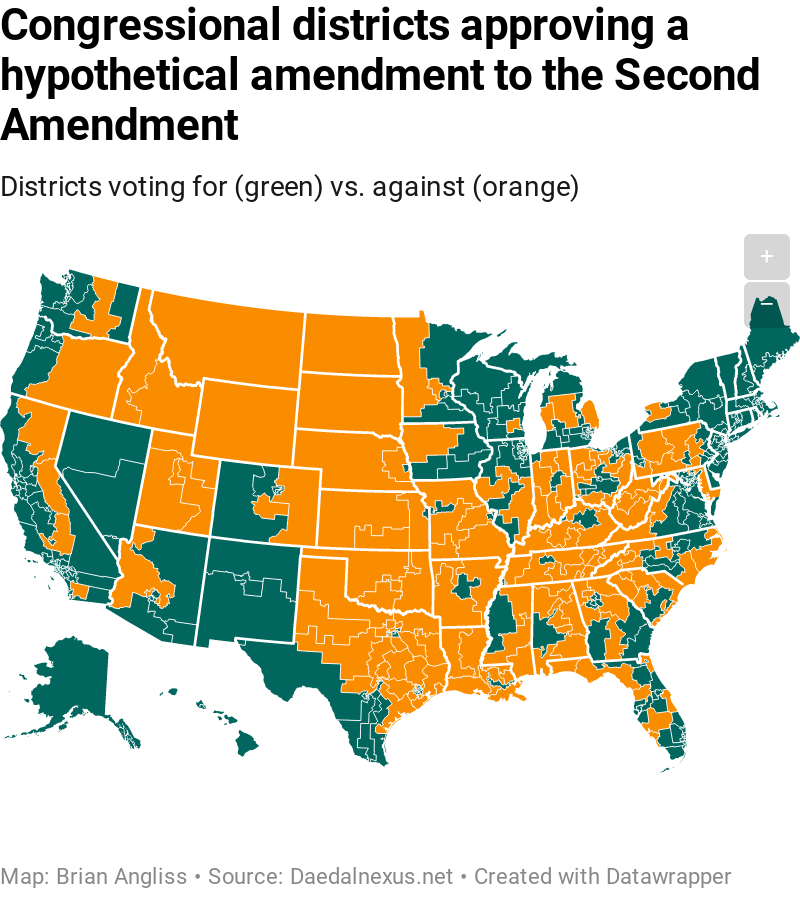
First, the top 2/3rds most liberal Congressional districts represent 216 million people out of the 326 million estimated by the US Census Bureau in 2018. That’s 66.37% of all Americans, slightly below the ideal 66.67% because of population shifts since the last time the Census was performed in 2010. The districts include 90 million housing units out of a total of 138 million, or 65.08% of all housing units.
Second, the representation of men and women isn’t much different. The top 2/3rds most liberal Congressional districts represent 106 million men and 110 million women, or 66.21% vs. 66.53% respectively.
Third, the differences are a little more pronounced when we look at the split by age. The largest group represented by the top 2/3rds most liberal Congressional districts is 25-34 year olds (31.2 million, or 68.98%), while the smallest group is 75-84 year olds (9.8 million, or 63.56%). If we look at 65 years and older vs. younger than 65 years old, the difference is 64.23% vs. 66.78% respectively. The reason for this becomes a little clearer when we look at the urban-rural divide below.
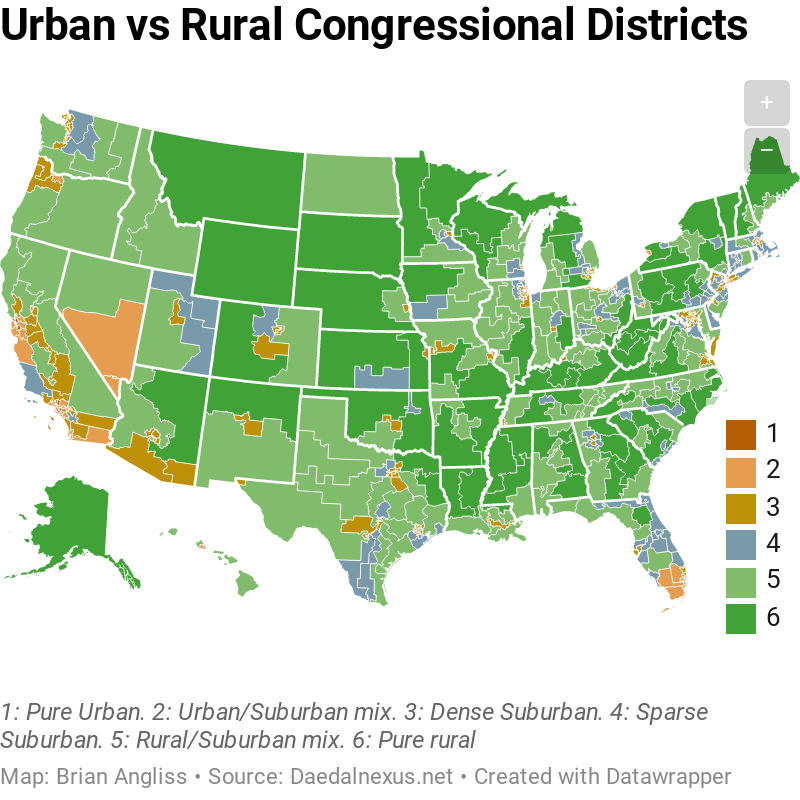
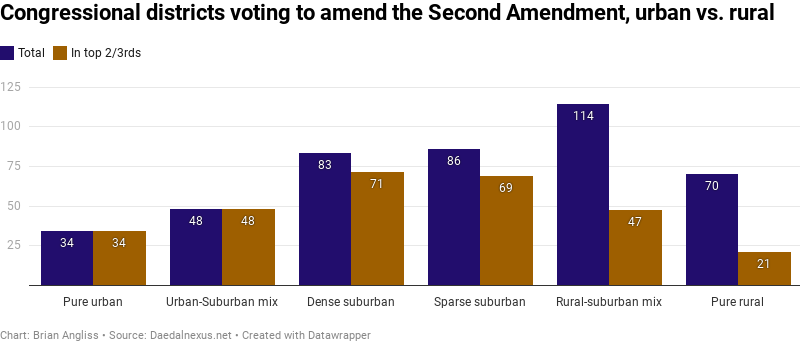
In this case, we see that the PVI metric we used to determine the most liberal 2/3rds of the House covers all of the pure urban districts, all of the urban-suburban mix districts, 85.5% of the dense suburban districts, and 80.2% of the sparse suburban districts. But where the coverage falls is in rural-suburban mix districts (only 40.2%) and the purely rural districts (30.0%).
| Total | In top 2/3rds |
% | |
|---|---|---|---|
| White alone (inc. Hispanics) | 235.9M | 146.1M | 61.94% |
| Black or African American alone | 41.3M | 30.8M | 74.67% |
| American Indian and Alaska Native alone | 2.8M | 1.7M | 61.20% |
| Asian alone | 18.4M | 15.7M2 | 85.47% |
| Native Hawaiian and Other Pacific Islander alone | 626k | 498k | 79.57% |
| Some other race alone | 16.2M | 13.3M | 84.47% |
| Two or more races | 11.3M | 8.1M | 72.08% |
Finally, the largest differences occur when we look at ethnicity. The table at right shows that the top 2/3rds most liberal Congressional districts represent over 85% of Asians, nearly 75% of Blacks/African Americans, but only 62% of Whites (which includes Hispanics in the dataset I grabbed) and American Indians/Alaska Natives.
Generally speaking, more whites live in rural areas, and the rural areas that are majority minority tend to vote strongly Democratic. The bulk of American Indians/Alaska Natives reside in purely rural districts, but tend to be minorities even in those districts, and so they’re not as strongly represented.
Still, we’re talking about a total of 216.7 million people, broadly representative of sex, age, and ethnicity. More than that, we’re not talking strictly Democratic districts. In order to reach 2/3rds of all Congressional Districts, districts that are clear Republican strongholds would need to have their politics upended on the issue of gun control in order to pass an amendment. The PVI ranges from Democratic+44 to Republican+33, and districts that were Republican+9 were needed in order to reach the 2/3rds of all Congressional districts. That includes Don Young of Alaska, Ted Yoho of Florida, Ann Wagner of Missouri, Sean Duffy of Wisconsin, and Andy Barr of Kentucky, among literally dozens of other stalwart Republicans and gun rights advocates.
To say that a sea change would be required in order for Representatives with an A grade from the NRA (Barr) for their advocacy of gun rights to shift positions enough to amend the Second Amendment is an understatement.
The Senate
But what about the Senate? What percentage of the United States would be represented by the 2/3rds most liberal Senators?
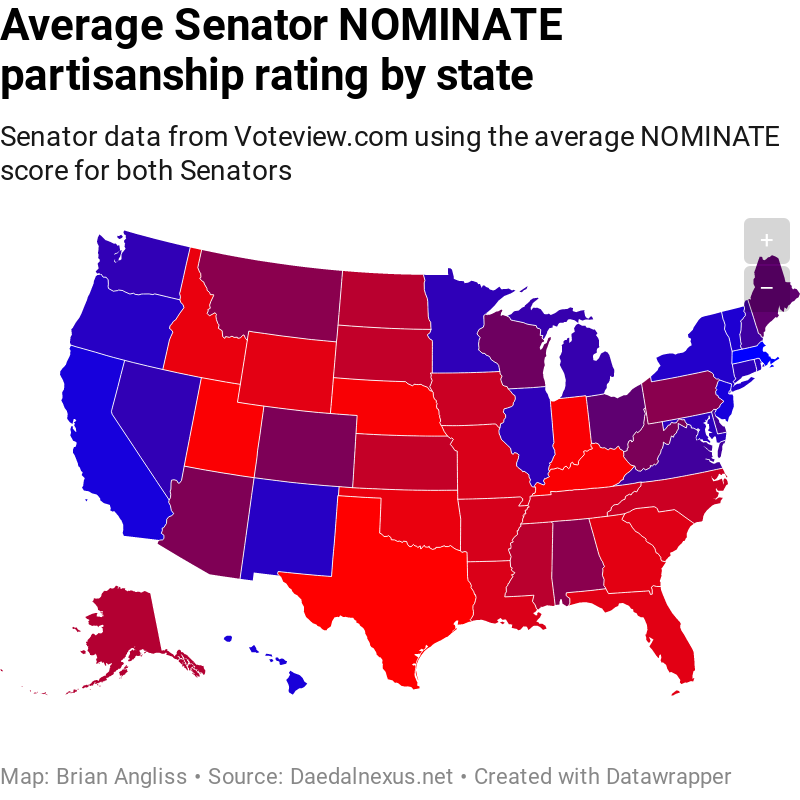

In this case I used NOMINATE data collected by Voteview.com to rank every Senator from the most liberal to the most conservative and then compared that to state-level population for 2018 as estimated by the US Census Bureau. In cases where the population of a state was split between a Senator who was in the top 2/3rds most liberal and one who was not, I divided the population of the state and put one half into the “amend the Second Amendment” side and the other half into the “don’t amend it” side. Because each state gets two Senators regardless of its population, I expected that 2/3rds of the Senate would be less representative of the population of the United States, and that’s exactly what the data shows.
With respect to the overall population of the US, the top 2/3rds most liberal Senators collectively represent 204.6 million people, out of a total of 326.5 million in 2018. This is only 62.68% of the US population for the Senate, and it’s down from the 66.37% of the population for the House. Similarly, the Senators represent 86 million housing units out of 138 million, a drop from 65.08% of housing units for the House to 62.22% for the Senate.
As with the House, the representation of the Senators is about equal across the sexes – 100.8 million men (62.72%) vs. 103.8 million women (62.64%), and again both are down from the House for men and women (66.21% vs. 66.53% respectively).
When we look at the age of people represented, we see that the percentage of people represented by the top 2/3rds is lower across the board, as expected, but that it’s the young who are least represented by the Senate and the old who are most represented. The lowest percentage age group represented (10-14 years old) is only 61.45%, while the highest percentage age group (85 years and older) is 64.66%. But the difference between the under 65 group and the 65 years and older group are less than 1% overall (62.62% vs. 62.97% respectively).
There are a lot of different ways to assess how urban a state is – overall population density, urban population minus rural population, or the percentage of a state’s population that lives in an urban vs. rural areas – but every method I came up with had some flaw. As such, I chose not to perform this particular assessment for the Senate at this time.
| Total | In top 2/3rds |
% | |
|---|---|---|---|
| White alone (inc. Hispanics) | 235.9M | 145.5M | 61.70% |
| Black or African American alone | 41.3M | 22.5M5 | 54.50% |
| American Indian and Alaska Native alone | 2.8M | 1.8M | 64.03% |
| Asian alone | 18.4M | 14.8M | 78.70% |
| Native Hawaiian and Other Pacific Islander alone | 626k | 509k | 81.32% |
| Some other race alone | 16.2M | 12.1M | 74.38% |
| Two or more races | 11.3M | 7.7M | 68.58% |
The largest change in representation is in the ethnic makeup of the constituents represented by the top 2/3rds most liberal Senators. From the following table, we can see that the percentage of Whites is about the same, but that the percentage of Blacks/African Americans and Asians is quite a bit lower. This suggests that the 2/3rd subset of the most liberal Senators represent a significantly less diverse population than the 2/3rds most liberal Representatives.
Again, though, the top 2/3rds most liberal Senators include what would be perceived today as pro-gun rights, conservative stalwarts. For example, Roy Blunt of Missouri, Mitt Romney of Utah, John Thune of South Dakota, Lamar Alexander of Tennessee, and Senate Majority Leader Mitch McConnell of Kentucky.
Imagine how much toward gun control the country would have to shift in order for these men, or more likely their replacements, to support amending the Second Amendment.
The States
Even if an amendment to the Second Amendment could get past the House and Senate, it would face an even more difficult hurdle to jump before it could become part of the US Constitution. Any amendment must still be ratified by ¾ of all state legislatures. The question is how many citizens would be represented by those ¾ of all state legislatures?
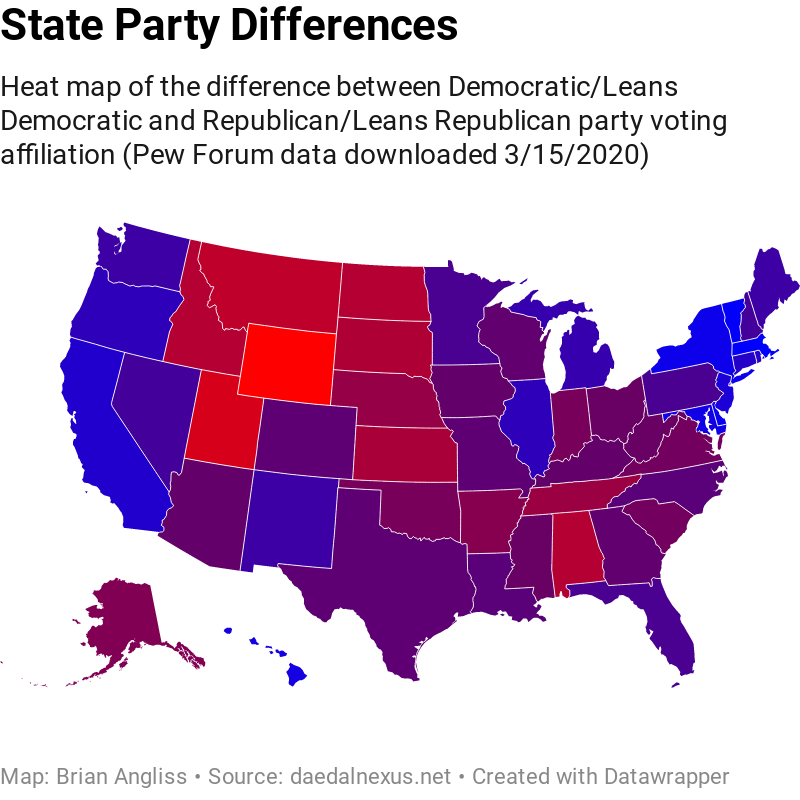
In order to estimate this, I took data on political party membership and Republican/Democratic leaning independents from the Pew Forum and compared it to the same state-level population estimates data from the US Census Bureau. I then sorted the states by the difference between the percentage of voters who are Democratic or lean Democratic and the percentage of voters who are Republican or lean Republican. I tried an alternative method (ranked by Democratic and leans Democratic voters only) but ultimately decided I preferred the original method I discuss below. Both methods are available in the source data for this post in a Google Sheets file titled “Amending the 2nd Amendment Data.”
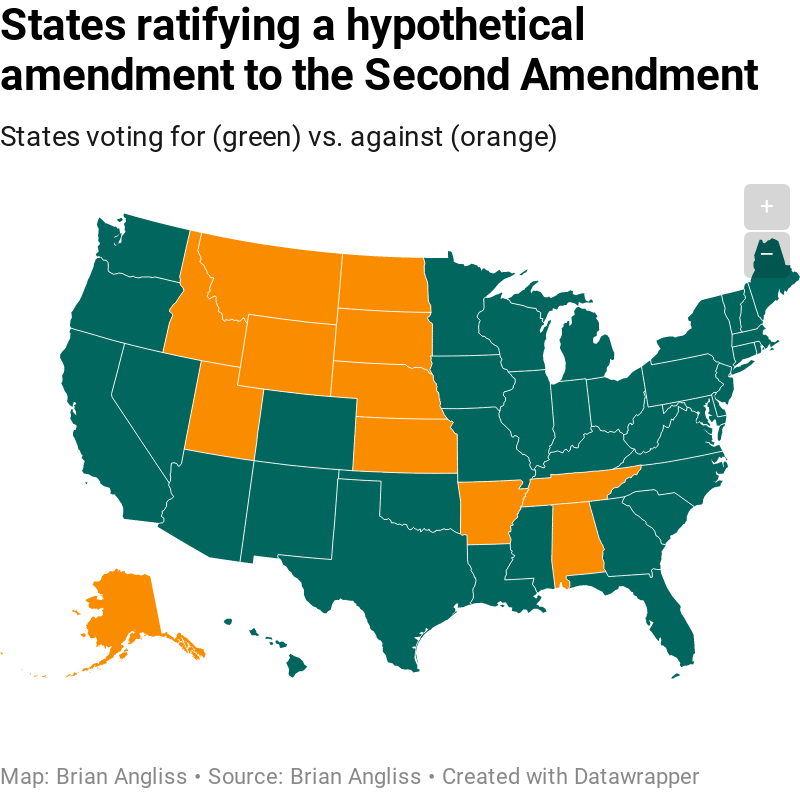
What I discovered is that the most liberal ¾ (38) of the states represent 91.29% of the entire population of the United States in 2018 – 298.0 million people of the total 326.5 million. 90.95% of all housing units. 91.24% of men. 91.33% of women. 91.43% of people aged 65 and older. 91.26% of everyone younger than 65 years old.
90.43% of Whites and Hispanics. 92.02% of Blacks/African Americans. 82.85% of American Indians and Alaska Natives. 97% of Asians. 89.85% of Native Hawaiians and other Pacific Islanders. 95.93% of people who claimed some other ethnicity, and 92.79% of people who claim two or more ethnicities.
Looking at the Pew Forum data, the states included in the top ¾ most Democratic include the usual liberal strongholds like Massachusetts, New York, and California. But it also includes swing states like Florida and Michigan and purple states with strong hunting traditions like Colorado and Missouri. And it includes some strong pro-gun Republican states like Texas, Arizona, Mississippi, and Oklahoma.
So the top ¾ of states as assessed by how liberal they are represents a supermajority of Americans far in excess of ¾ of the population. And the majority would come from across the political spectrum from Democratic strongholds to strong gun-rights supporting states. The only areas that would likely remain steadfast against amending the Second Amendment are the most rural states in the Rocky Mountain and plains regions.
—
As we would expect, getting an amendment through Congress is very difficult, but it’s easy compared to getting an amendment ratified by the states. Overwhelming majorities of Americans would have to vote in pro-gun control Representatives and Senators and keep them in office for at least 4 years because of how slow the Senate turns over. And overwhelming majorities of Americans would have to vote in pro-gun control state legislatures and Governors for at least 4 years for the same reason.
And that’s after a massive shift in US culture and views towards guns swept even conservative and Republican strongholds.
Clearly, if any amendment to the Second Amendment were to pass and be ratified, it would require overwhelming support from the American people as a whole, not just from the House and Senate, and certainly not just from gun control advocates.
For other parts of this series, click here

Leave a comment